Resampling & sampling frequency
Why are data resampled for the data viewer?
Data shown in the timeline are sometimes downsampled to maintain low refresh rates. Without resampling, the timeline of NoldusHub would not be able to load and refresh all data fast enough for a smooth visualization. However, data are stored at device sample frequencies.
How are data resampled?
If you zoom in on the timeline, dots will visualize individual samples. Subsequent samples are connected with a line so it's easier to recognize trends. If you zoom out, sample dots will start overlapping. To prevent clutter, the sample dots will disappear at this point and only the line that connects the sample dots will be shown. If you zoom out even further, this line will consist of selection of samples only. For this selection, an algorithm takes the first sample of every 1/2000th interval of the total time range in the graph. This means that short-lived changes in the data might not show up in the timeline. Instead, zoomed-out data will be less cluttered and better outlined for a general impression. If your interest lies in shortlived fluctuations of the signal, you can zoom in again to inspect data at a higher spatial resolution.
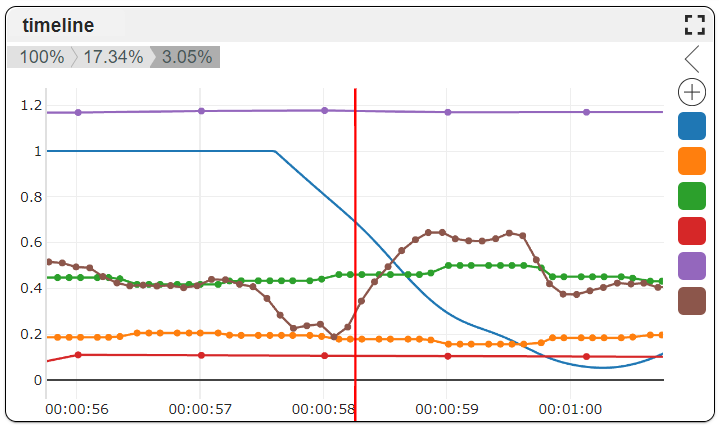
This image shows signals at different sampling frequencies. When zooming in to a view range of 4 seconds, low-frequency signals (the red and the purple lines)
What sampling frequencies are used?
The device output frequency is maintained for data stored in the database and for data that is exported (downloaded). So, sample frequencies of stored data are identical to device sample frequencies.
When shown in the timeline, sample frequencies depend on the zoom level. Hower, downsampling for the timeline maintains always a 2000 samples for the entire view. If that view spans 1 hour (3600 seconds), the average sample frequency in view will be 2000/3600 [1/s], i.e. 0.56 Hz.
Differences between device-native signals and derived signals
Devices like the Shimmer ECG and the webcam can produce data at 512Hz and 60Hz respectively. An electro-cardiographic signal needs to be sampled at such high sample rates to detect fast fluctuations in the PQRST complex of the ECG. However, NoldusHub uses these signals to compute derived signals like the heart rate, interbeat interval for the Shimmer ECG and facial expressions for the Webcam video. There is no need to record these derived signals at high frequencies since heart rate, interbeat interval and facial expression do not nearly fluctuate as fast as the device sampling frequency. Therefore, heart rates and interbeat intervals and facial expressions are sampled at 10Hz. Electrodermal tonic signals and peak rates fluctuate even less fast. Therefore these derived signals are sampled only once per second.

No Comments